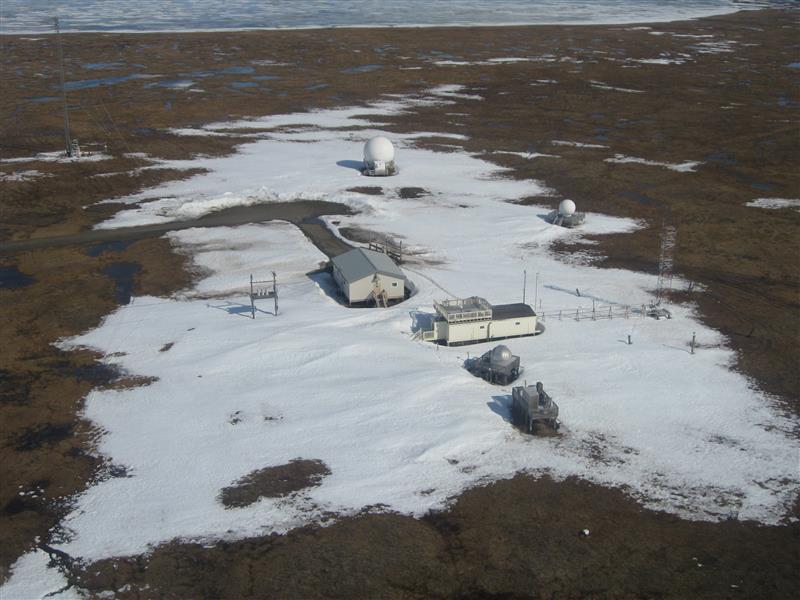
As station chief of the National Oceanic and Atmospheric Administration (NOAA)’s Barrow Observatory, Bryan Thomas has had a front-row seat to the dramatic changes taking place in the Arctic.
On the shores of the Beaufort Sea, just above 71 degrees north, lies the National Oceanic and Atmospheric Administration’s Barrow Observatory. Since 1973, two year-round technicians have made the 10-kilometer (6-mile) journey from town by snowmobile each day to check up on the instruments collecting the critical atmospheric and weather data that ultimately make up our climate record. (That’s after they survey the grounds to make sure no polar bears are hiding under radar platforms, of course.) At a tumultuous time in the Arctic, when all numbers seem off the charts at first glance, it’s an incredibly important job.
In January, sea ice in the Arctic was observed as the lowest in the 38 years of satellite records, and 250,000 square km (100,000 square miles) less than in 2016. Between November 2016 and January 2017, Barrow hit an average temperature of 4.4F (-15.3C), significantly up from the average of -7.9F (-22.2C) set between 1921 and 2015. Overall, temperatures in the Arctic in 2016 were by far the highest since 1900.
As station chief of the observatory, Bryan Thomas has had a ringside seat to the dramatic changes taking place in the Arctic. With this winter proving one for the record books, Arctic Deeply recently spoke with Thomas about how we collect pivotal scientific data and what it’s like manning the northernmost point of the United States.
Arctic Deeply: What are the logistics of getting out to the station?
Bryan Thomas: One of the things that attracted me to the Barrow Observatory is that I can live in a house, sleep in a nice bed, get up and go to the field, and come home at night. We have a cot and a sleeping bag, water jugs, some provisions out there if we do get stuck or have to stay up there for some reason, but, by and large, we’re back and forth to the observatory. It is about 6 miles [10km] out of town because we want to be on the edge of the ocean; we want to have that nice clean air from the east. That’s why we are where we are.
Arctic Deeply: What does a typical day look like up there? What kind of work are you doing?
Thomas: We have instruments that we take care of, and those need to be cleaned, calibrated and adjusted. We are observing the environment, but we’re also observing the instruments observing the environment. We have a second-order effect. We need to be sure the data we’re collecting about the environment is reliable and so we keep a dataset that tells us whether an instrument is performing the way we would expect. We have atmospheric sampling and magnetic field sampling, and we have some satellite antennas that we take care of.
One of the things that we’re doing is looking at the concentration of carbon dioxide. The background level of the atmosphere has gone up 80 parts per million in the 40 years that we have been monitoring at Barrow – from around 320 parts per million to over 400 parts per million. As a technician at the Barrow Observatory, my job is to make sure that that carbon dioxide record is as bulletproof as I can make it. I need to be able to tell you exactly why we did what we did to our instrument; and that we are using our instrument the same way it always has been. It’s a way for that science to be quality-checked. I have to make sure that the 40-year time series continues with as few breaks as possible.
So, once a week, we also do a sweep of air flasks where we take the same air we’re sampling at each hour and put it into bottles that we send to the NOAA laboratory in Boulder, Colorado, to check that our instruments are working properly. Our atmospheric data record should correlate with data gathered in other parts of the world, such as Greenland and Svalbard, and the flasks analyzed on site should track well with the data analysis done in Boulder.
Arctic Deeply: This has been a highly abnormal year for winter sea ice extent in the Arctic. What have you been able to witness from the observatory?
Thomas: We’re within a mile of the shore of the Beaufort Sea. When we look out from our observatory, we can see about 10 miles [16km] out – and it’s flat. But because we’re not high up, we can’t necessarily see the sea ice lead. However, we can see the phenomenon of “water sky.” When there’s open water, the albedo [reflective power] is lower, and the clouds reflect the ocean’s darkness – the same way that a storm cloud looks grey. [If sea ice was plentiful, unbroken for hundreds of miles like it has been historically, the clouds would be white out over the ocean.] Today, the water sky isn’t there anymore. It’s gone. Typically, we reach maximum sea extent in March. But what is the larger trend? This year, I observed the sea ice come much later. We had open water with active waves in October, and that’s something that’s relatively new. Usually in October we would have significant ice offshore already.
This article originally appeared on Arctic Deeply.

