

Disclaimer and information on use and purchase
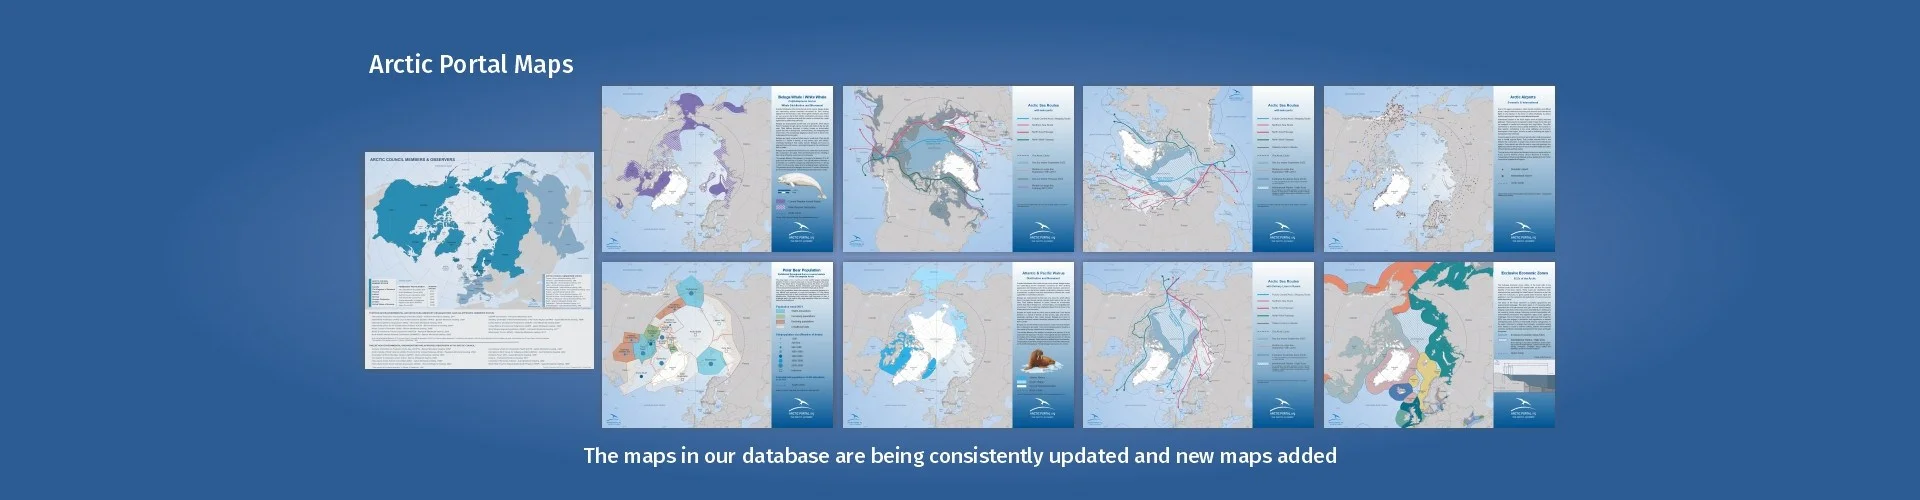
The maps are free for use in outreach and educational presentations and free publications in the resolution and format provided above as long as its origin, ArcticPortal.org, is clearly accounted for.
The maps are all available in higher resolution for purchase via the download button.
Any commercial use of our free maps, which includes and/or not limited to presentations or publication in reports, books, online media or commercial applications is NOT permitted. For any commercial use the maps are available for purchase via the download option. For other use, special requests or modifications please contact . Any third party amendments, copying or resale of the Arctic Portal maps, is not permitted without a written agreement with the Arctic Portal.
Please note that cartographic material, as our maps, is covered under the international "Convention for the Protection of Literary and Artistic Works". The agreement covers derivative works as well.
Purchasing instructions
For purchasing commercial use and/or the higher resolution of maps please follow the Buy Map link which also indicates the price. You will be directed to a secure payment form at Rapyd, registered to the Arctic Foundation, the official operator of the ArcticPortal.org. After payment a zip folder with the purchased map will be downloaded to your browser and you will receive an invoice to your email address provided in the registration form or simply email . To locate your zip file, open the downloads directory for the browser that you used to perform the payment. If you have any problems with this process please contact
The Arctic Portal.org is operated by the Arctic Foundation. Arctic Foundation is registered in Akureyri, Iceland, according to Icelandic Act no. 119/2019 on not-for-profit organizations operating across borders. Registration nr. 610721-1090.